项目 APHH-Beijing 介绍。
Information for the paper
Title: Introduction to the special issue "In-depth study of air pollution sources and processes within Beijing and its surrounding region (APHH-Beijing)"
Author: Shi Zongbo
Year: 2019
Journal: Atmospheric Chemistry and Physics
URL: https://doi.org/10.5194/acp-19-7519-2019
APHH Programme
The Atmospheric Pollution and Human Health in a Chinese Megacity (APHH-Beijing) programme is an international collaborative project focusing on understanding the sources, processes and health effects of air pollution in the Beijing megacity.
Four research themes:
- sources and emissions of air pollutants;
- atmospheric processes affecting urban air pollution;
- air pollution exposure and health impacts;
- interventions and solutions
Advantage of this programme:
However, our understanding of sources and emissions of key air pollutants such as PM2.5 and ozone and the role of the interactions between physical and chemical processes in the development of pollution events in Beijing is still far from being accurate or complete. In addition, none of the abovementioned large programmes have been directly linked to health effect studies.
Why Beijing:
Air pollution is particularly severe in developing megacities, such as Beijing, where pollutants from traditional sources, such as solid fuel combustion are mixed with those from modern vehicles (Guan et al., 2014), on top of regional pollution from industrial and other anthropogenic activities. Air pollution in Beijing is different from that in well-studied developed megacities, such as Paris and London, in a number of ways including the lack of diesel emissions in the inner city, the use of coal in surrounding rural areas for heating and domestic cooking (Tao et al., 2018), the high emissions of air pollutants in neighbouring provinces (Hebei and Tianjin) and the high oxidising power due to the complex chemistry (Zhang et al., 2009; Li et al., 2017; Lu et al., 2018). This makes Beijing a particularly interesting place to study as it provides an atmospheric environment with major contrasts to developed megacities such as London and Paris in which to investigate urban pollution processes.
Sites and Date
urban: the Institute of Atmospheric Physics in central Beijing The winter campaign had two main sites. The urban site (39°58'33'' N 116°22'41'' E) is located in the tower section of the IAP, Chinese Academy of Sciences, where the 325 m meteorological tower is located. The site, between the fourth and third north ring roads of Beijing (Fig. 1), is in a residential area. Typical of central Beijing, there are various roads nearby. To the south, north and west ends there are roads about 150 m away. On site, there are two to three floor buildings to the south, and the east and west ends of the tower are surrounded by small trees and grass. There is a canal right to the north of the site. Further to the west is a park covered mainly by conifer pine trees (Yuan Dynasty Wall Heritage Park).
rural: Pinggu in rural Beijing The rural Pinggu site in Xibaidian village (40.17°N, 117.05°E) in north-eastern Beijing was collocated with the AIRLESS project cohort. Xibaidian village is about 4 km north-west of the Pinggu town centre and about 60 km from IAP. There are several similar small villages nearby. The monitoring station and the clinic used an unoccupied house at the north end of the village away from significant local combustion sources. A two-lane road is about 300 m north of the site. With no centralised heating infrastructure available, residents mainly use coal and biomass for heating and cooking in individual homes.
Date:
- winter: 2016.11.10 - 12.10
- summer: 2017.05.21 - 06.22
Instrumentation
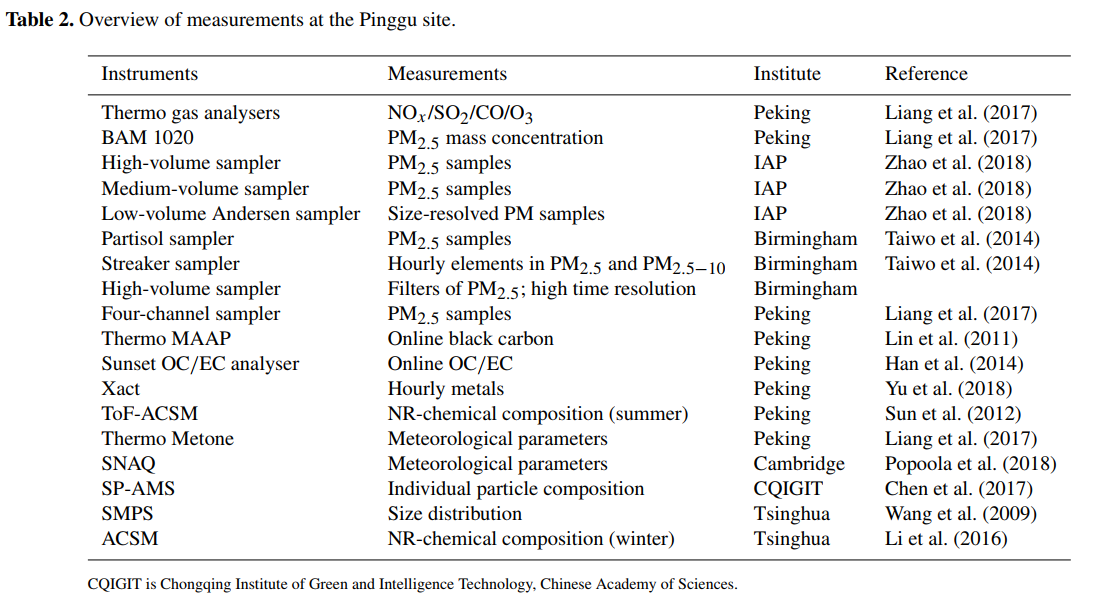
At Pinggu, online instruments (Table 2) were run within an air-conditioned room on the ground floor with inlets on top of the building. High-, medium- and low-volume PM samplers were deployed on a newly modified flat roof of the single-storey building.
Synoptic-scale meteorology during the field campaigns
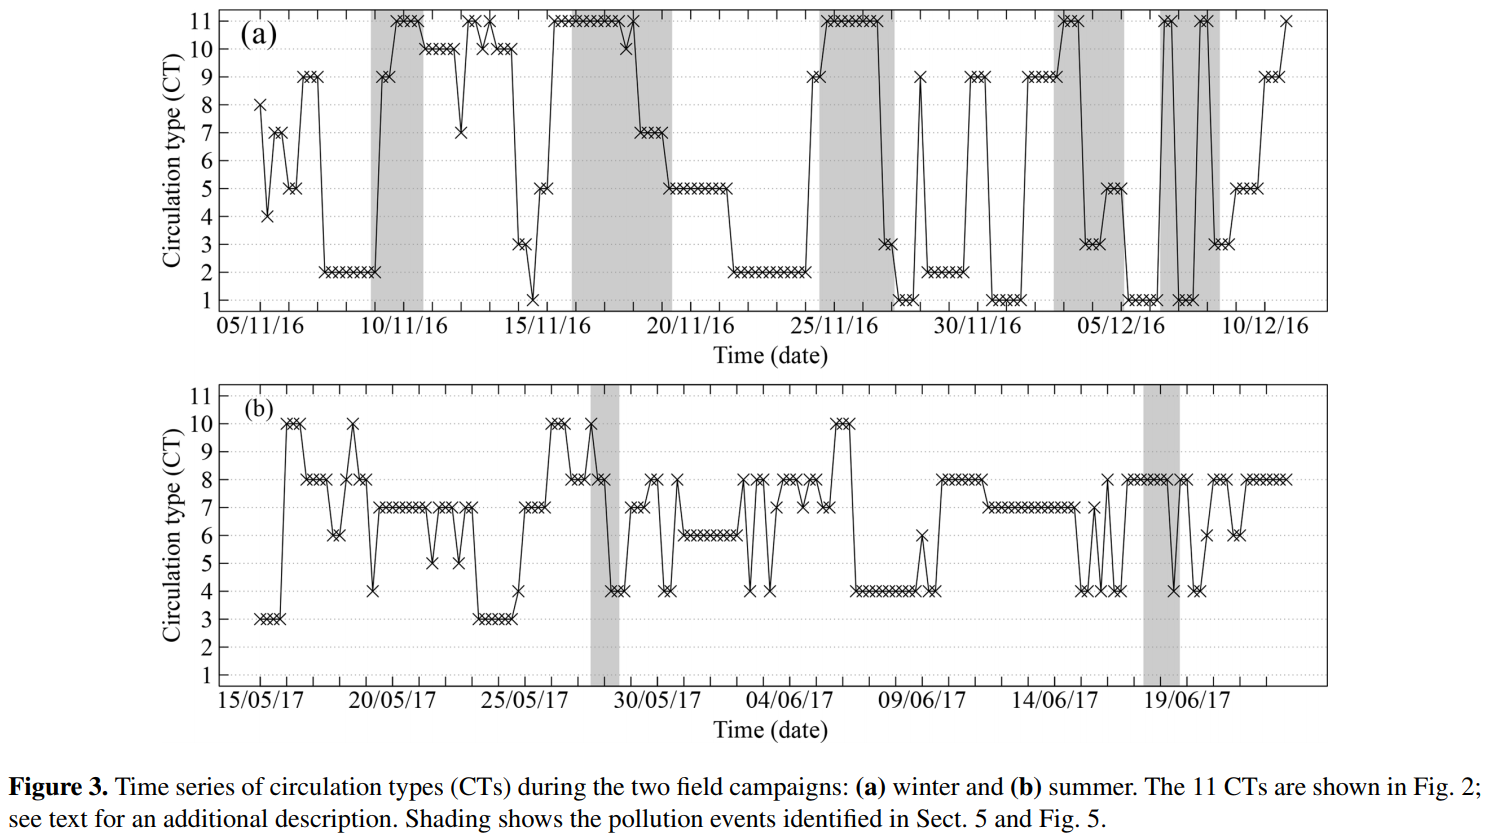
As expected, the CTs that occurred during the two field campaign periods are different (Fig. 3).
During the winter field campaign, the most frequent circulation type was CT 11 (26 % of the 6 h periods) which was often preceded by a period of CT 9 (total 13 %). Circulation types 9–11 are associated with air masses that may stagnate over the Beijing urban area (Fig. 2). CT 1 (accounting for 12 % of the time) and CT 2 (17 %) are associated with the Asian winter monsoon which brings cold and dry air masses to eastern China.
During the summer campaign (Fig. 3b), the most frequent CTs were 8, 7, 4 and 6 (33 %, 25 %, 19 % and 10 % of the time, respectively). CTs 8 and 6, which did not occur during the winter campaign period, are associated with the summer monsoon, advecting moist, warm air from the south and south-east (Fig. 2). While southerly and northerly flows converge over Beijing for CT 6, slightly weaker low pressure to the north-east means north-westerly flow dominates for CT 4. High pressure to the west or south of Beijing is rare during the summer campaign, so that CTs 1, 2, 9 and 11 do not occur, and CTs 3 and 5 are rather rare (5 % and 1 %, respectively).
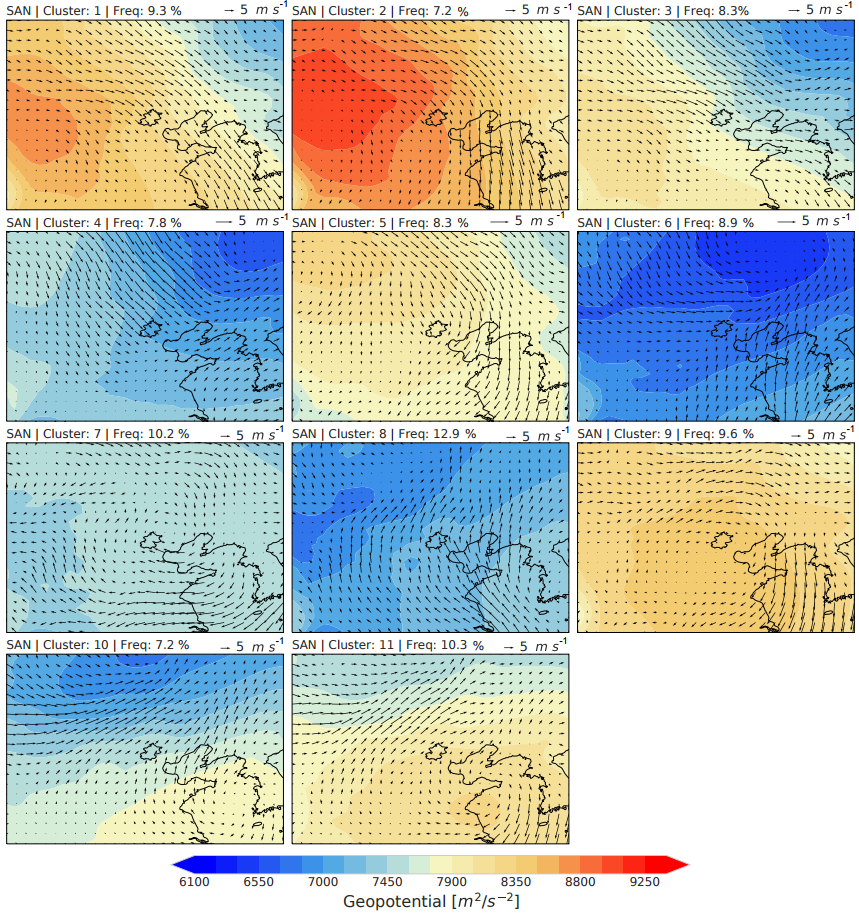
Figure 2. ERA-Interim (1988–2017) average 925 hPa geopotential with 10m horizontal wind vector for 11 circulation types classified for Beijing (municipal boundary; thin solid line) surroundings (31–49◦ N, 103–129◦ E) determined with the SANDRA method (COST733 class software). Frequency of occurrence is given in the cluster caption. For a discussion of conditions associated with each CT, see Sect. 4.3.
Meteorological conditions during the field campaigns
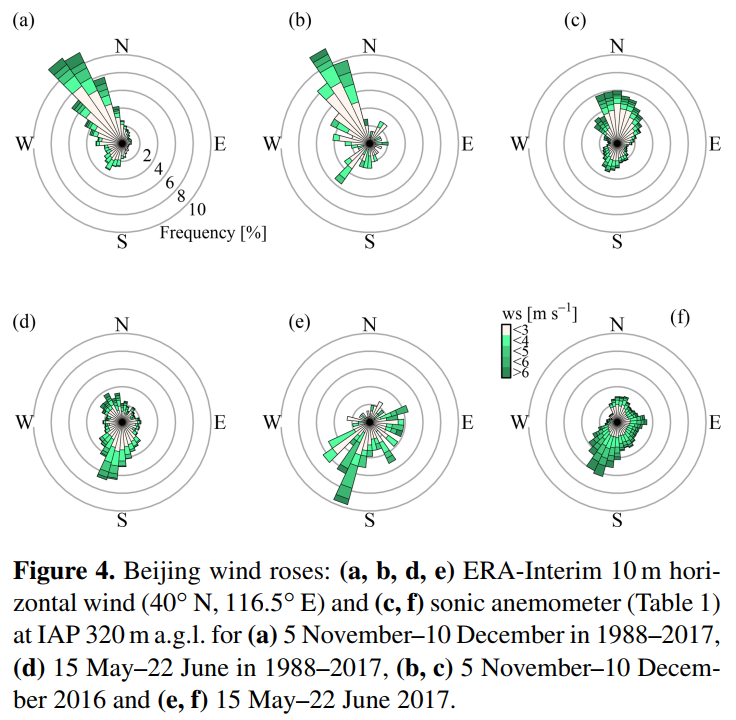
- The 30-year climatology (Fig. 4a, d) confirms the clear seasonality in wind direction affecting the occurrence of CTs discussed (Sect. 4.3); i.e. during the winter intensive campaign period (10 November–10 December), north-westerly flow clearly dominates, while southerly wind directions are most common during the summer campaign period (20 May– 22 June).
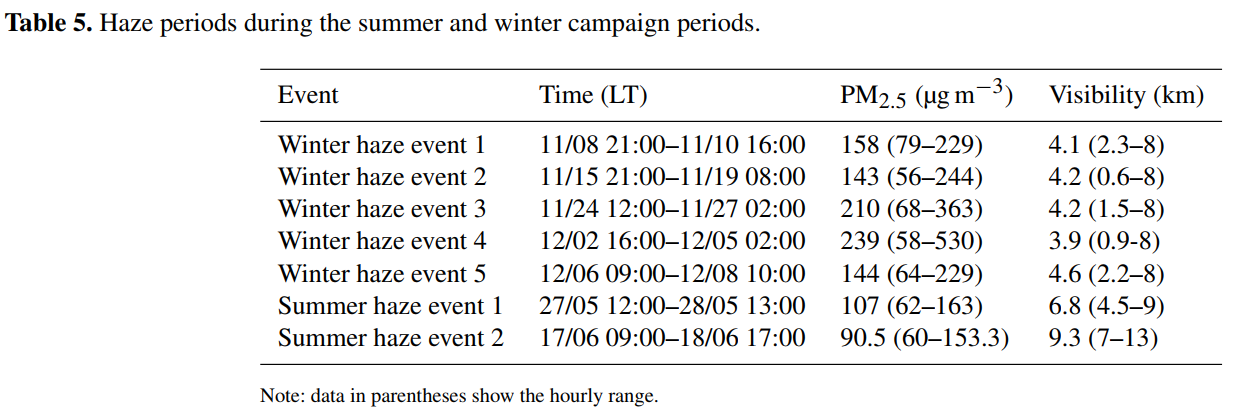
- In addition, south-westerly flows were more frequent in winter 2016 (Fig. 4b and c) than during the 30-year average climatology (Fig. 4a), which had the potential to bring more polluted air in the upwind Hebei province to the observation sites in Beijing.
Air quality during the field campaigns
Winter
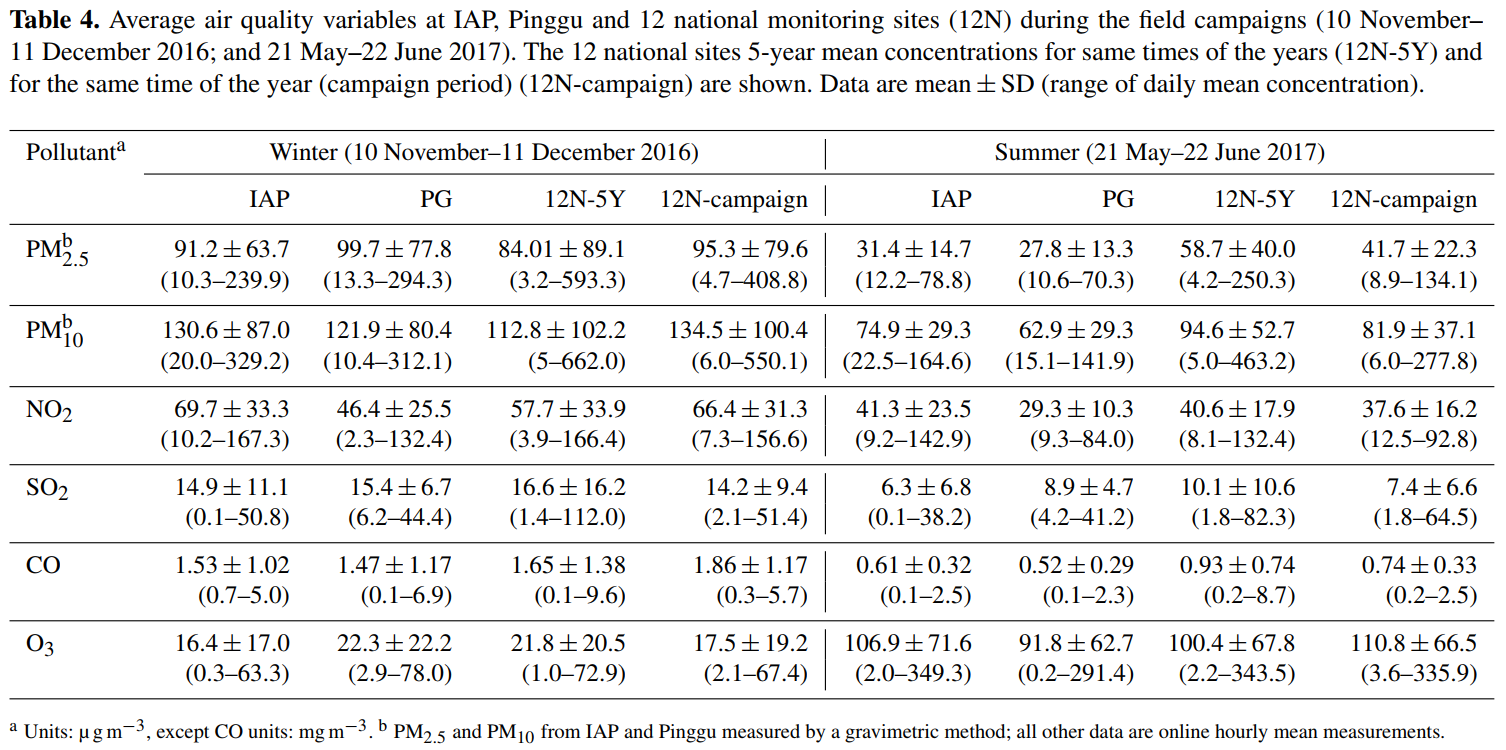
- The daily average concentration of PM2.5 was 99.7 μg/m−3 at Pinggu (Table 4; based on Partisol gravimetric measurements).
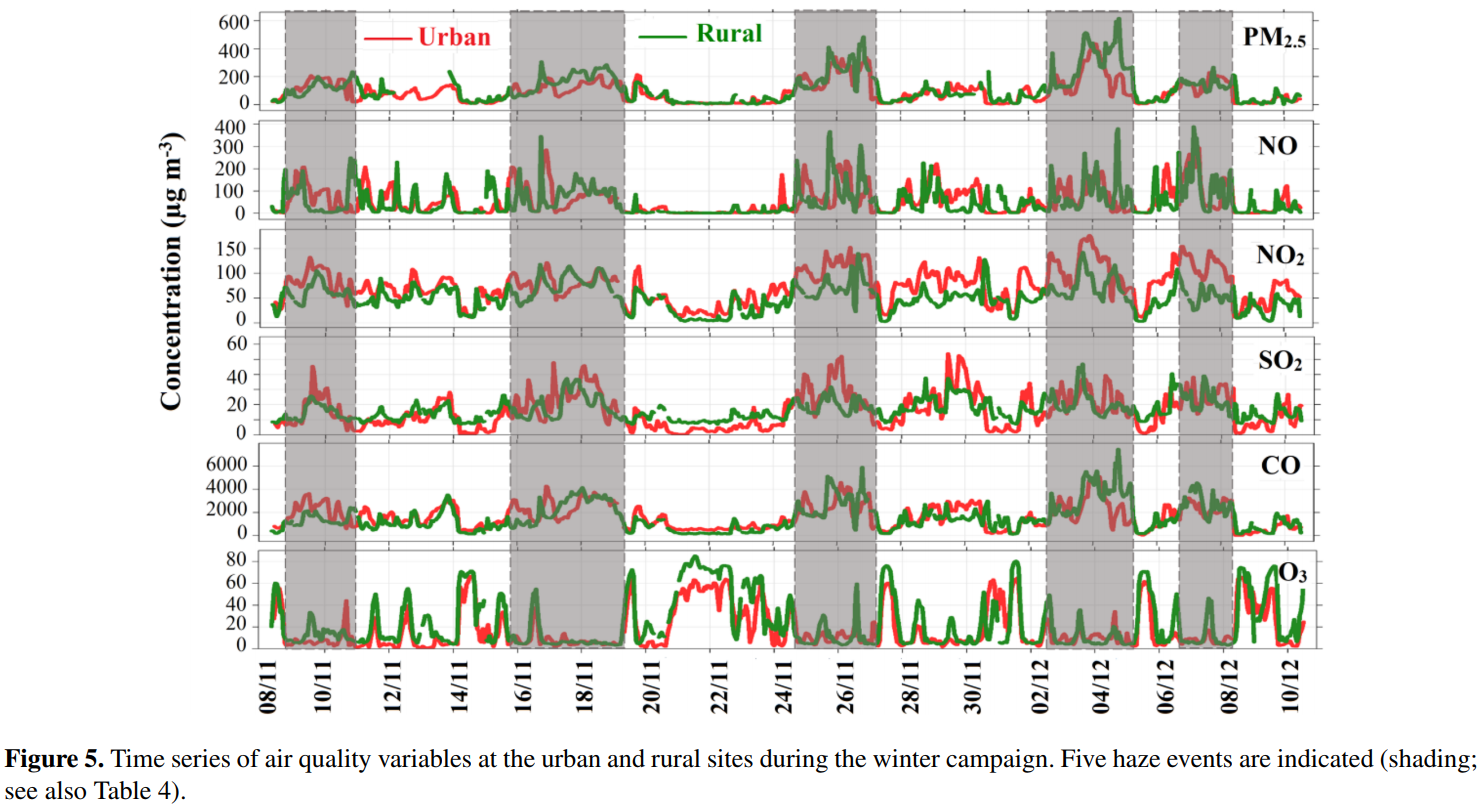
- The maximum hourly PM2.5 concentration was 617 μg/m−3 (Fig. 5). Similar to that at IAP, nearly 50% of the hours had PM2.5 mass concentrations greater than 75 μg/m−3 .
- Average concentrations of NO2 , O3 , SO2 and CO are 46.4±25.5, 22.3±22.2 and 15.4±6.7 μg/m−3 and 1.47±1.17 mg/m−3 , respectively (Table 4).
- PM2.5 was slightly higher at the rural site but NO, CO
and SO2 were comparable between the two sites.
- PM2.5 and O3 each had similar temporal patterns at the urban and rural sites (Fig. 5), indicating a synoptic-scale meteorological impact.
- The larger difference in the temporal variation of NO, NO2 and SO2 may reflect the varying contribution of more local sources.
- Large differences in temporal patterns of air pollutants were found on 4 December 2016 when PM2.5 , SO2 and NO concentrations were much higher at Pinggu than at IAP.
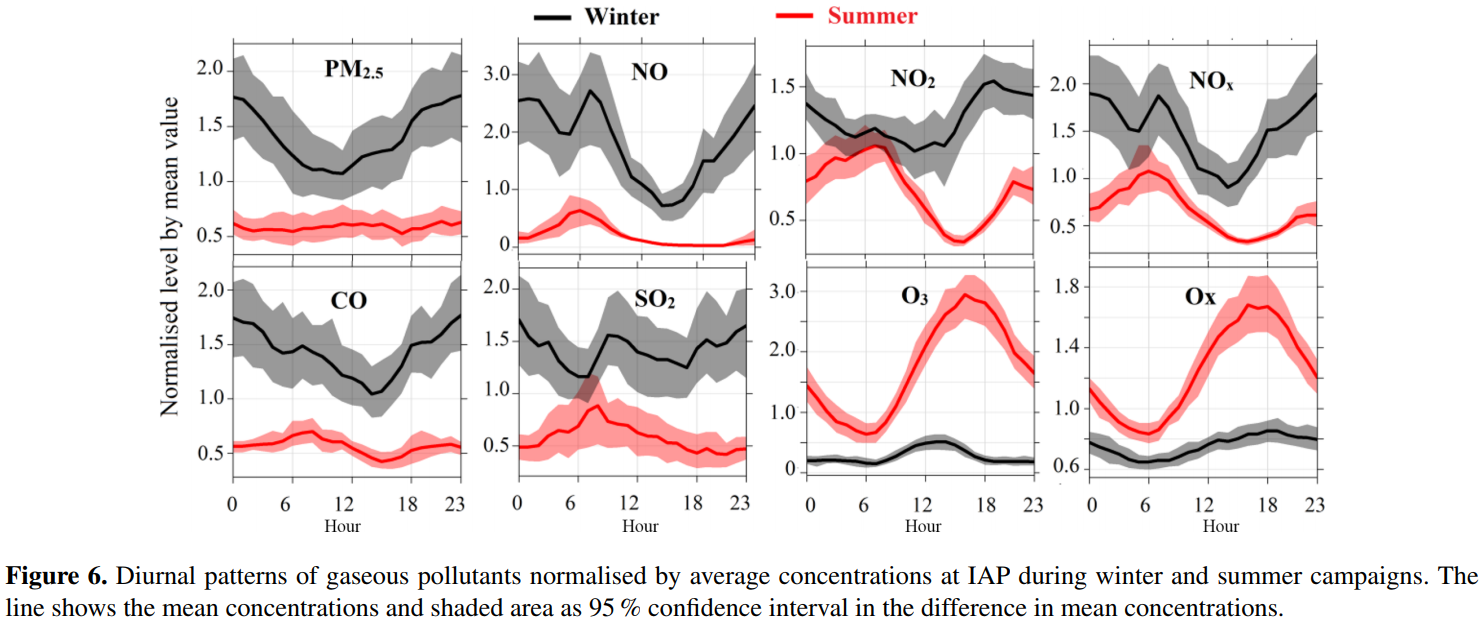
- Diurnal cycles of particles, NO2 and CO showed no distinct peak but an increment during the nighttime, suggesting the possible impact of boundary layer and/or anthropogenic emissions in winter (Fig. 6).
- The peak NO levels at 07:00 LT are likely caused by the morning rush hour road traffic.
- PM2.5 concentration increased sharply from 18:00 LT at Pinggu (not shown), suggesting important local emissions, likely domestic heating and cooking.
- All pollutants, except O3 , had higher mass concentrations when wind speeds were low, suggesting an influence from the local sources.
Summer
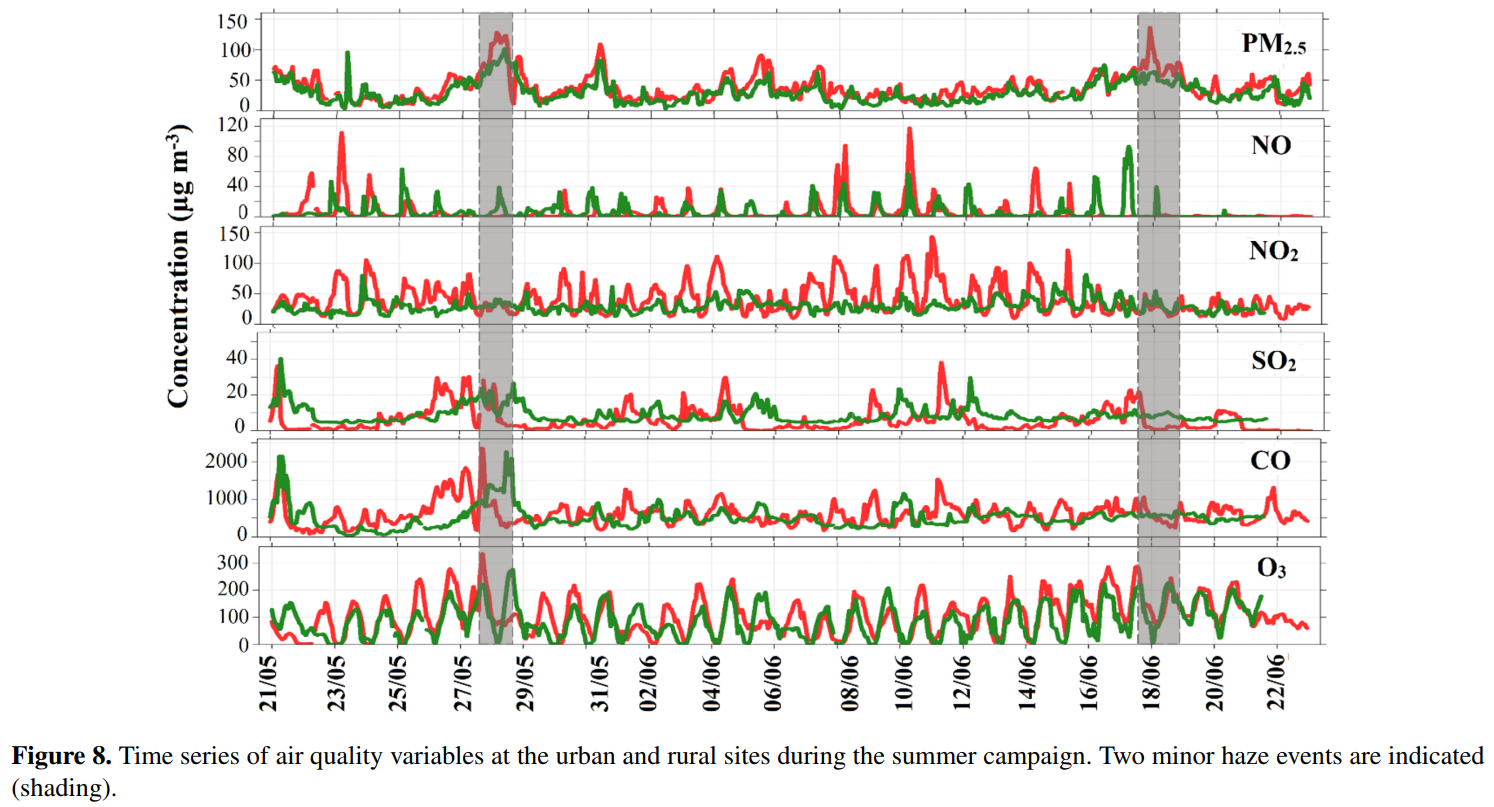
- All pollutants except PM2.5 show more or less different temporal patterns (Fig. 8), suggesting differences in sources at Pinggu and IAP during the summer campaign.
- Diurnal patterns of NO, NO2 and CO at IAP showed a distinct peak in the early morning, suggesting the contribution of traffic emissions (Fig. 6).
- O3 and Ox concentration peaked mid-afternoon. Unlike winter, high ozone concentrations occur during southerlies to south-westerlies, suggesting a regional source of this pollutant.
- NO and NOx were largely from local sources during the summer campaign.
Air quality in the wider Beijing megacity during the field campaigns
- The particularly high spatial correlations of both PM2.5 and O3 across almost all sites indicate a regional pollution phenomenon for the two pollutants.
- PM10 , CO and NO2 at the urban sites are highly correlated but not with the rural and suburban sites (G2, G9 and G10; Fig. 1), suggesting a more local source for these pollutants, comparing to PM2.5 and O3 ;
- The Pinggu site has relatively high PM2.5 pollution during the winter campaign but has the lowest concentrations during the summer campaign. This suggests that local anthropogenic sources have a major impact on PM2.5 at this site during the winter campaign.
- This lends further confidence that the chosen urban site represented well the overall pollution levels in the Beijing urban area.
Synoptic circulation and air quality
- Relatively low wind speeds of CT7 may contribute to the long haze event from 15 to 19 November 2016.
- Most haze events during the winter campaign are cleared out by fresh air masses being advected from the north in CTs 3 or 5 (Fig. 3), which is also marked by the increase in wind speed observed (Fig. S1).
- Relatively lower PM2.5 concentrations occurred (Fig. 10b) under NE flow conditions (CTs 1–5) and higher concentrations during southerly flow (CTs 6–8, 10). The highest PM2.5 concentrations occur during the heating season when regional flow showed stagnation (CTs 9, 11). All haze events during the winter campaign (Figs. 3 and 5) are dominated by those CTs, although CTs with NE flow conditions occurred for short periods within the haze events (e.g. 18 November 2016, 4 December 2016).
- Ozone levels are highest during CTs 5–8 (Fig. 10c), which predominate during spring and summer (Fig. 10d).
Summary of air quality during the campaigns
- In summary, the winter campaign was characterised by several high PM2.5 pollution events, with peak hourly concentrations ranging up to 617 μg/m−3 (at Pinggu), whereas the summer experienced events of high ozone concentrations with the highest hourly average of 335 μg/m−3 (at IAP).
- Synoptic-scale meteorological analysis suggests that the greater stagnation and weak southerly circulation in November/December 2016 contributed to the poor air quality during all haze events detected, and overall the PM2.5 pollution level was similar to the 5-year average (2013–2017).
Preliminary air quality modelling and pollution climatology of the campaign periods
- However, there is a strong local contribution to this, as evident from the lower concentrations measured at Pinggu (Fig. 8), and these local differences are not fully resolved with the model.