细颗粒物源解析:高时间分辨率化学组分监测数据 + 受体模型(PMF) + 空气质量模型(NAQPMS) + 足迹模型(footprint model)
Information for the paper
Title: High-time-resolution source apportionment of PM2.5 in Beijing with multiple models
Author: Liu Yue
Year: 2019
Journal: Atmospheric Chemistry and Physics
URL: https://doi.org/10.5194/acp-19-6595-2019
Introduction
- Therefore, it is important to have a better understanding of the major source types and their contribution to PM2.5 in order to formulate effective sciencebased policies and regulations.
- Receptor models, including the chemical mass balance model (CMB) and positive matrix factorization model (PMF), are the most commonly used methods of source apportionment in China and are implemented by application of mathematical methods to measurements of chemical composition of fine particles at receptor sites (Cooper et al., 1980; Gao et al., 2016; Lv et al., 2016; Zheng et al., 2005).
- Previous studies have indicated that PM2.5 pollution in Beijing has been significantly influenced by regional transport and meteorological conditions (Han et al., 2015; D. Li et al., 2017; Zhao et al., 2013).
- Li et al. (2016) found that regional transport highly contributed to the rapid increase stage of PM2.5, with the transport height ranging from 200 to 700m above ground level with application of the Nested Air Quality Prediction Model System (NAQPMS).
- Han and Zhang (2018) used a regional air quality modeling system coupling with ISAM (integrated source apportionment method) and found that air pollutants derived from Hebei and Shandong provinces were major contributors to PM2.5 in Beijing, with contributions up to 25% and 10 %, respectively.
- The goal of the study is to link the contribution of different sources by PMF with the source regions by footprint and the regional transport contribution by NAQPMS. The combination of multiple models gives greater power to identify specific sources and source regions.
Materials and methods
Online measurements of PM2.5
- Online PM2.5 mass concentrations were continuously measured using a tapered element oscillating microbalance (TEOM 1405F, Thermo Fisher Scientific Inc.).
- Organic carbon (OC) and elemental carbon (EC) were simultaneously monitored by a semi-continuous OCEC carbon aerosol analyzer (Sunset Laboratory Inc.) with 1 h time resolution.
- An in situ Gas and Aerosol Compositions monitor (IGAC, Model S-611, Fortelice International Co. Ltd.), which collects both gases and particles simultaneously, was applied to measure water-soluble ions online with 1 h time resolution in this study.
- Twenty-three trace elements in PM2.5 were measured by an Xact 625 Ambient Metal Monitor (Cooper Environmental Services LLC, USA) with a 1 h time resolution.
- Organic matter (OM) was calculated as OM = 1.6×OC (Turpin and Lim, 2001).
- Mineral species was calculated as mineral = 1.89 Al + 2.14 Si + 1.4 Ca + 1.43 Fe + 1.66 Mg (Zhang et al., 2003). The concentrations of Al, Si, Fe and Mg were calculated by the concentration of Ca and the composition of urban soils of Beijing: Al = 1.7 Ca, Si = 7.3 Ca, Fe = 0.7 Ca and Mg = 0.3 Ca (An et al., 2016).
- “Others” were calculated by subtracting OM, EC, mineral and secondary inorganic aerosol (SIA, including SO42-, NO3-, NH4+) concentration from total PM2.5 concentration.
Positive matrix factorization (PMF)
- The principle and detailed information of USEPA PMF 5.0 model can be found in Paterson et al. (1999) and the EPA 5.0 Fundamentals and User Guide.
Footprint analysis model
- The footprint model developed by Peking University was used to simulate the potential source region of air pollution. The footprint is a transfer function in a diffusion problem linking the source and the measurement result at a point (receptor) (Pasquill and Smith, 1977).
- The meteorological data used to drive the footprint model were provided by the Weather Research and Forecasting model (WRF-ARWv3.6.1), initialized using the Final Analysis (FNL) data from the United States National Centers for Environmental Prediction (NCEP).
The Nested Air Quality Prediction Model System (NAQPMS)
- NAQPMS is a 3-D Eulerian chemical transport model with terrain-following coordinates, developed by the Institute of Atmospheric Physics, Chinese Academy of Sciences (IAP/CAS) and has been validated by the Ministry of Environmental Protection of China (CMEP, 2013).
- The MIX anthropogenic emission inventory was used (M. Li et al., 2017), with the original resolution of 0.25° (about 25 km at midlatitudes) and the year of 2010.
The combination of multiple models
- The footprint model was used to provide the direction of source regions, while the NAQPMS model was run to calculate the contribution of local emission and regional transport.
- Based on online measurements of PM2.5 species including specific source tracers, the receptor model (PMF) can be used to obtain precise source apportionment results but with no information on regional transport. Therefore, the footprint and NAQPMS model were simultaneously conducted and combined with the PMF model to link the source type and contribution to PM2.5 in Beijing by receptor models with different source regions.
Results and discussion
Mass concentration and chemical composition of PM2.5
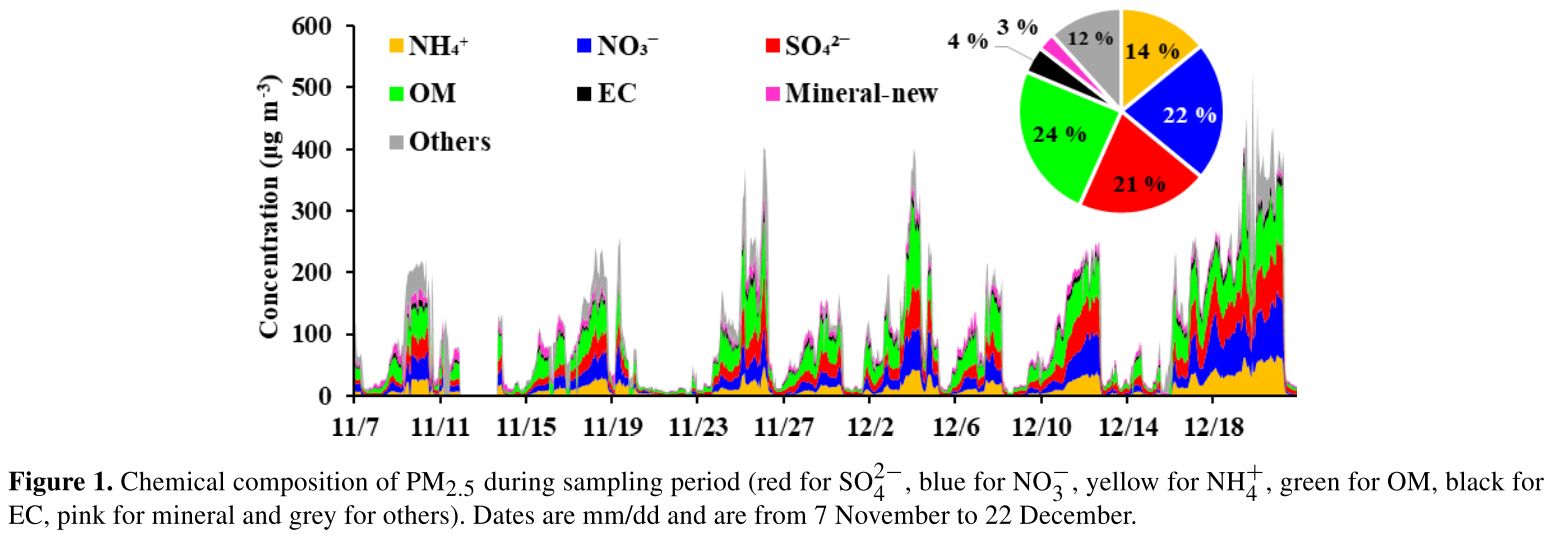
- Figure 1 shows that SIA and OM were the predominant PM2.5 components in winter in Beijing, accounting for 57% and 24% of total PM2.5 mass, respectively.

- The OC/EC ratio is often used to indicate the contribution of primary emission sources and secondary organic aerosols (SOAs) (Lim and Turpin, 2002; Zheng et al., 2014). In this study, the OC/EC ratio ranged from 1.36 to 7.92 with an average ratio of 3.91±0.91, which was lower than that in the winter of Beijing in 2013 (5.73±2.47) (Yan et al., 2015).
- In general, the large contribution of SIA and OM, as well as the high OC/EC ratio, indicated the importance of secondary formation in winter in Beijing (Y. Sun et al., 2016), while the high concentration of species like SO42- and K suggested a significant contribution of combustion sources including coal combustion and biomass burning to PM2.5.
- Taken together, all these variations of source specific PM2.5 compositions suggested a more significant influence of combustion sources to PM2.5 in haze episodes and relatively higher contributions of dust sources in nonhaze periods.
Source apportionment during haze and nonhaze periods
- Factor 2 was highly loaded on metal species including Mn, Fe, Cu and Zn, which were mostly used as indicators for industrial sources.
- Factor 4 was mostly loaded by EC, OC and moderately loaded by Cu and Zn, which were mainly emitted from lubricant additive of vehicles and wear of brake and tyre.
- In previous studies, cooking was one of the important sources of PM2.5, contributing to about 10% on average in East Asia (Chafe et al., 2014; Sun et al., 2013), but in this study, cooking sources were not identified by PMF due to the lack of organic tracers.
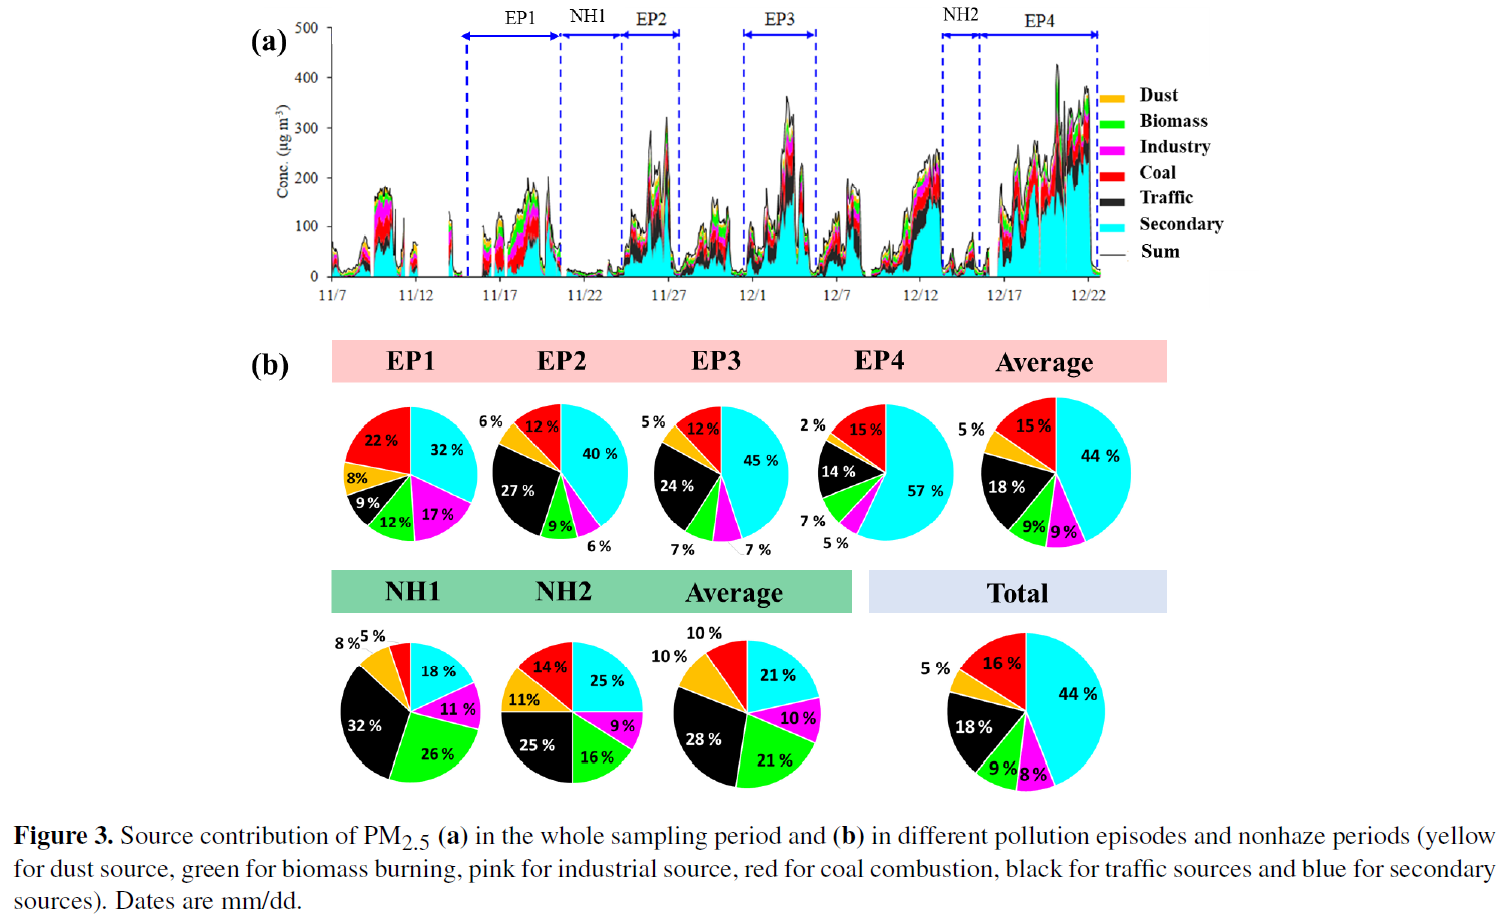
- During the campaign, the source contribution in Beijing ranked as secondary sources (44%) > traffic sources (18%) > coal combustion (16%) > biomass burning (9%) > industrial sources (8%) > dust (5%).

- The four pollution episodes were characterized by low wind speed around 2 m/s and high relative humidity (RH) compared to nonhaze periods.
- The chemical composition and sources of the four pollution episodes varied from each other, but relatively high contributions of secondary sources were observed in all episodes (32%–57%), and the contribution increased with PM2.5 concentration (see Fig. 2).
- The contribution of coal combustion and industrial sources in EP1 (14–19 November) was the most significant compared with other episodes, which were 22% and 17 %.
- The traffic source contributions in EP2 (24–27 November) and EP3 (1–5 December) were higher than other pollution episodes, accounting for about 22%.
- Generally, secondary sources were predominant (~ 50 %) to PM2.5 in pollution episodes, while traffic sources (~ 30 %) became more important in nonhaze periods.
- However, source contributions of PM2.5 could vary from episode to episode. EP1 was more influenced by primary sources, while EP4 was characterized by high secondary source contributions (57 %).
Evolution of different types of haze episodes
- It can be seen that EP1 was characterized with high local contributions (69%–89%) and primary source contributions to PM2.5.
- The contribution of primary sources, especially for traffic sources, increased when footprints were primarily located in the local area.
- The above results confirmed that high-time-resolution source apportionment result can be integrated with footprint and NAQPMS model to identify the rapid evolution of different episodes – EP1 was mainly caused by local emission from transportation and coal combustion, while EP4 was typical of regional transport from southwestern areas of Beijing with increasing contributions of secondary sources.
Relationship of PM2.5 sources by PMF with regional transport estimated by NAQPMS
- Receptor models which are used for source apportionment have the limitation that they cannot quantify the local or regional transport contribution.
- Comparing with Fig. 8 b and c, the two primary combustion sources showed the opposite relationship to the local contribution, indicating that the pollutants from biomass burning were mainly transported from the surrounding areas of Beijing, while those from coal combustion were more influenced by local emission.
- The results suggested that locally emitted coal combustion contributed significantly to PM2.5 in Beijing in winter 2016 and the strict control strategies for coal combustion were essential to improving air quality in Beijing. In the meantime, more control of biomass burning and precursors of secondary sources in surrounding areas are also needed to mitigate air pollution in Beijing.
- The local footprint was predominant in winter in Beijing (N = 79) with the contribution of 38%, followed by northern and southern footprint (N = 51, 45).
- It can be seen that local footprint was characterized by traffic (23%) and coal combustion sources (25%), while the contribution of secondary sources (26 %) was the lowest among the four types. On the contrary, secondary sources were predominant in southern footprint cases with the contribution of 53%, while the contribution of traffic sources decreased to 15%.
- The northern footprint was characterized by the highest contribution of dust sources (11%), which could be influenced by dust transported from Inner Mongolia.
- Eastern footprint, which mainly covered heavy industrial areas such as Tangshan and Shenyang, showed higher contribution of industrial sources (10%) and coal combustion sources (18%).
Future prospects
- In previous studies based on online measurements, organic tracers are also not commonly used due to current technical difficulties in carrying out online and quantitative measurements of organic species with high-time resolution.
- However, some organic tracers are believed to be more specific for certain sources, such as levoglucosan for biomass burning, hopane and sterane for traffic sources and cholesterol for cooking sources.
- Therefore, future online measurements of organic species could be conducted, which will be very helpful in identifying sources.
- In the future, the integration of ambient measurements with the air quality model should be considered at a vertical level as well.
Conclusions
- As the predominant sources of PM2.5 in Beijing, secondary and biomass burning sources were more influenced by regional transport, while coal combustion sources increased with local contribution.
总结与启发
- SIA 和 OM 是北京冬季PM2.5的主要成分。高占比的 SIA 和 OM,结合高比值的 OC/EC 表明次生气溶胶的重要性。高浓度的钾和硫酸根离子表明燃烧源(煤炭燃烧和生物质燃烧)的贡献较大。
- 污染期表现出低风速和高湿度的气象特征。
- 北京城区冬季来源解析表明,二次源 (44%) > 交通源 (18%) > 燃煤源 (16%) > 生物质燃烧源 (9%) > 工业源 (8%) > 扬尘源 (5%).
- 在不同的污染事件中,颗粒物的化学组成比例和污染源贡献比例会有所不同。但是,在所有污染事件中,次生源的贡献都相对较高,且其贡献占比随着PM2.5浓度的增加而增加。除了次生源,燃烧源在灰霾天的贡献较大,交通源和扬尘源在非灰霾天的贡献增加。
- 煤炭燃烧和生物质燃烧,这两种重要的燃烧源的来源区域不同。煤炭燃烧主要来自北京本地,而生物质燃烧更可能来自周边区域。
扩展阅读
- Cooper-1980-Journal of the Air Pollution Control Association: 受体模型介绍
- Paterson-1999-EST: PMF模型
- Sun-2016-SR: 灰霾的快速形成和爆发
- Chafe-2014-EHP: 使用固体燃料家庭烹饪对细颗粒物和疾病的影响