文献泛读合辑。
Paper 1
Yao-2011-AE: A study on the extent of neutralization of sulphate aerosol through laboratory and field experiments using an ATOFMS and a GPIC
- In this study, experiments using artificially generated sulphuric acid nucleated aerosol and metal sulphate aerosol across a range of Extent of neutralization (EoN) found that the peak area ratio and hit ratio of ion m/z -195 (HSO4H2SO4-) to ion m/z -97 (HSO4-) detected by the ATOFMS increased with decreasing EoN.
- In ambient air measured by the ATOFMS and a Gas Particle Ion Chromatograph (GPIC) in Toronto, Canada, ion m/z -195 was always detected in ammonium sulphate aerosol, and its hit number and peak area varied widely, regardless of EoN indicated by the equivalent ratio of NH4+ to (SO42- + NO3-). Thus, ion m/z -195 alone is not an indicator of acidic sulphate aerosol.
- The average relative peak area of a negative ion (or positive ion) was defined as the peak area of that ion over the total peak area of all negative ions (or positive ions). ... Peak areas >100 and >20 were used as the thresholds for the detection ions m/z -97 and m/z -195 respectively. Only a small portion of the particles with detectable levels of ion m/z -97 also contained detectable levels of m/z -195 whereas almost all particles with detectable levels of ion m/z -195 also contained detectable levels of m/z -97.
- The m/z -26 is usually attributed to the CN- ion, and was likely associated with vegetative debris or biomass burning. The m/z -26 could also be the C2H2- ion from primary combustion emissions.
- No relationship was found when comparing the temporal trend of the hits of particles with detectable m/z -195 to the EoN during the period. Thus, we conclude that the ion m/z -195 alone provides no indication of EoN. ... Ion m/z -195 peak area alone is not an indicator of EoN while the hit ratio of ion m/z -195 to ion m/z -97 can be a qualitative indictor of EoN in ambient aerosol.
Paper 2
Spencer-2006-AST: Using ATOFMS to Determine OC/EC Mass Fractions in Particles
- Historically, obtaining quantitative chemical information using laser desorption ionization mass spectrometry for analyzing individual aerosol particles has been quite challenging. This is due in large part to fluctuations in the absolute ion signals resulting from inhomogeneities in the laser beam profile, as well as chemical matrix effects.
- However, as shown herein, averaging the mass spectra of an ensemble of particles of the same size with similar chemical composition reduces the effects of the shot-to-shot single particle ion signal fluctuations.
- The UF-ATOFMS was operated down stream of a multiple orifice uniform deposit impactor (MOUDI) which removed over 50% of particles greater than 450 nm (aerodynamic diameter). For UF-ATOFMS data analysis, only particles between 50 and 400 nm were analyzed.
- Note that the major peak observed for the uncoated particles at 106 nm is shifted down to 76 nm upon coating, suggesting the 100 nm EC particles have collapsed. Using Scanning Electron Microscopy (SEM) and SMPS, spark discharge EC and diesel generated EC has been observed to collapse (rearrange) into a more spherical particle when coated with OC.
- The plots show a broad distribution of particle sizes. This wide distribution corresponds to EC particles coated with varying amounts of OC, as well as EC particles with a distribution of shapes.
- The uncoated EC area matrix is dominated by positive ion carbon cluster peaks 12C1 to 96C8 attributed to EC. A peak at m/z +28 is also observed which is attributed to silicon. ... The OC coated spark discharge EC in Figure 5 shows many peaks attributed to EC, however, it also contains OC peaks at m/z 27 (CNH+, C2H3+), 29 (C2H5+), 37 (C3H+), 39 (C3H3+), 43 (C3H7+ , C2H3O+), 51 (C4H3+), and 63 (C5H3+).
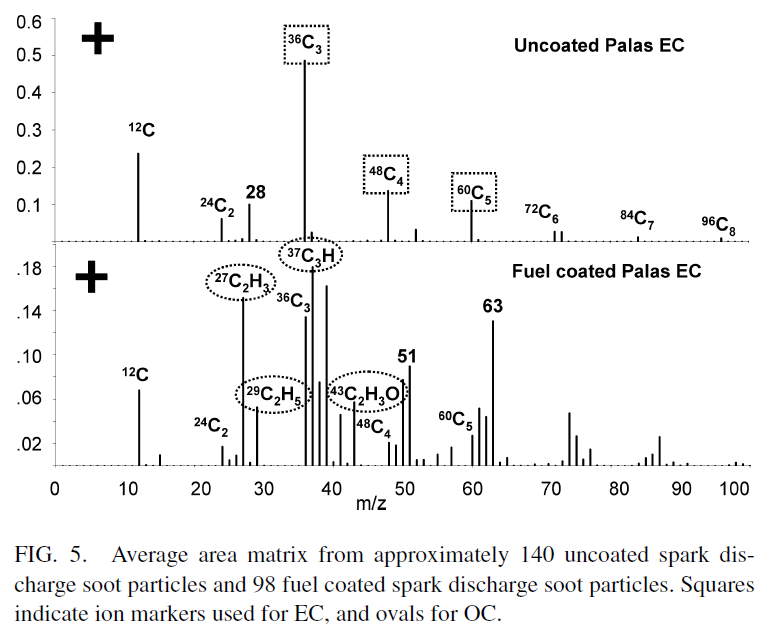
- To establish a correlation between OC/EC intensity ratios and the mass of OC and EC in particles, the ion markers shown in Figure 5 attributed to OC (m/z 27+, 29+, 37+, 43+) and EC (m/z 36+, 48+, 60+) are used as they are commonly observed in ambient particles. Other ions for OC such as m/z 39+, 41+, and 51+ were not chosen because ions from potassium and vanadium are also observed at these m/z in ambient particles. ... However, the signals tend to increase and decrease in the same proportion, and thus by using the ratio of OC to EC ion intensities to calculate the OC/EC mass fractions, the effect of the ion signal fluctuations on quantification is minimized.
- A linear correlation exists between the OC/EC ion ratio and mass percentage of OC calculated from assumed material densities with an R2 value of 0.98. ... A linear correlation with an R2 value of 0.99 is shown in Figure 6 for the percent of OC mass calculated from effective densities and the OC/EC ratios. ... These correlations show it is possible to calibrate the ATOFMS using ion intensity ratios and obtain quantitative chemical information for particles with similar chemical matrices. ... It is important to note that a break at 1 μm separates particles composed of predominately organic versus inorganic matrices. Thus this calibration curve will most likely be most effective for sub-μm particles since these will have similar carbonaceous matrices and thus similar ion signal responses.
- As shown, the OC/EC ratios for the ambient and vehicle data sets lie within the range of OC/EC ion intensity ratios observed for the laboratory generated OC-EC particles presented here. This suggests the OC/EC ratios calculated using laboratory generated OC-EC particle standards indeed have atmospheric relevance and can be used to estimate the fractions of OC and EC in ambient particles with similar chemical composition and size.
Paper 3
Xu-2017-STE: Mass spectra features of biomass burning boiler and coal burning boiler emitted particles by single particle aerosol mass spectrometer
- Particle samples were collected from a sugar factory which uses a biomass burning boiler (BBB) and from a power plant which uses a coal burning boiler (CBB) in Guangxi Province, China. ... The biomass burning boiler in this study burns bagasse from sugar cane to generate electricity. To consider the feasibility, samples were collected from bottom of electrostatic precipitators with a plastic brush.
- The experimental system consisted of a Resuspension Chamber, a single particle aerosol mass spectrometer (SPAMS), and an Electrical Low Pressure Impactor (ELPI).
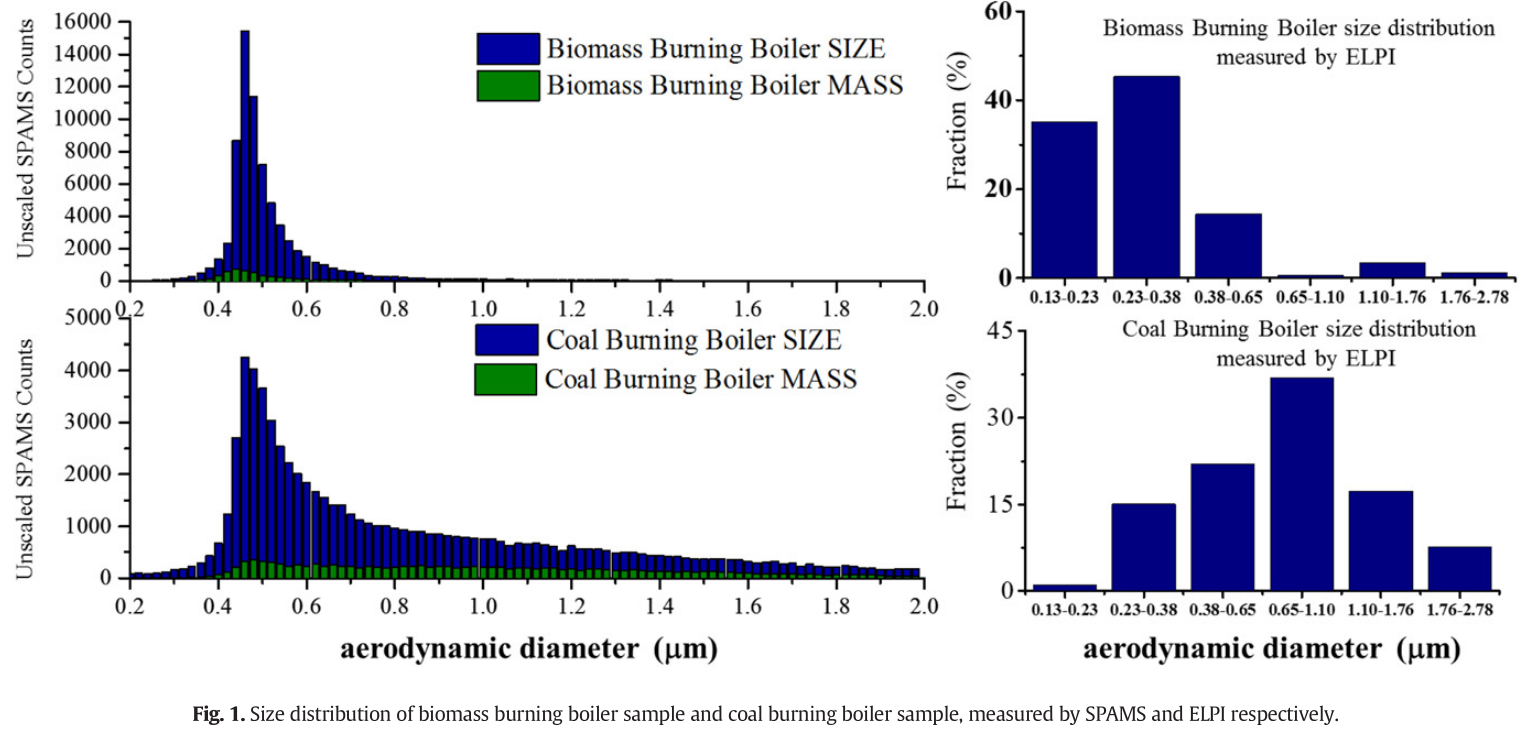
- Because the particle-detection efficiency of the SPAMS exhibits a strong dependence on particle size, thus the size distribution obtained by SPAMS is not the actual atmospheric concentrations. However, the size distributions remain useful for comparing particle types. ... By comparing the size distributions measured by SPAMS and ELPI, we determined that particles always peaked between 0.4 and 0.5 μm measured by SPAMS caused by higher particle passing efficiencies in this size range. Larger-sized particles were seldom detected because of lower passing efficiencies. Therefore, the SPAMS cannot provide quantitative measurements without appropriate scaling factors.
- Size distribution results measured by ELPI indicated that two samples produce different size distributions; the BBB sample concentrated in small particle size range and peaked between 0.23 and 0.38 μm, while the CBB particles concentrated in a larger size range and peaked between 0.65 and 1.11 μm.
- Sodium (m/z 23), aluminum (m/z 27), potassium (m/z 39), calcium (m/z 40, 56), organic fragments (m/z 37, 43, 50, 51, 61, 63), elemental carbon cluster ions, sulfate (m/z −80, −97), nitrate (m/z −46, −62), CN− (m/z −26, 42), phosphate (m/z −63, −79), silicate (m/z −60, −76) all presented in the spectra of BBB and CBB. However, the peaks of 27[Al]+, 40[Ca]+, and silicate are higher in CBB than those of BBB, while the peaks of carbon cluster ions and organic fragments are lower than those of BBB. This result indicates that inorganic compounds such as silicate, calcium, aluminum contribute a significant fraction of particles emitted from coal combustion.
- For both of BBB and CBB, intensities of 27[Al]+, 40[Ca]+, 56[Fe/CaO]+, and Si (m/z -60, -76), increase as the size increases, while the signals characteristic of elemental carbon 36[C3]+ and organic carbon 37[C3H]+ decrease. In addition, by comparing with other studies on chemical components of particles emitted by coal combustion source, Si, Al, Fe and Ca seemed to be the dominant components, but smaller particles tended to have less Si, which agrees with the size variation of m/z –76 signal intensity.
- For BBB particles in the 0.2–0.5 μm range,most of the particles were OC and EC-containing particles which contribute 35% and 23%, respectively, in addition to the 5% contributed by OCEC mixed particles. In the 0.2–0.5 μm size range, EC-containing particles also contribute the largest fraction (24%), followed by ECOC-containing particles (20%). In the 0.5–1.0 μm size range, silicate containing particle classes, such as silicate, Al_Ca_Ti_Silicate, Al_Ti_Silicate, Al_Silicate classes had much higher contributions than in 0.2–0.5 μm.
- To quantify the similarity of characteristic classes of two samples in the same size range, dot products were also calculated between two samples as shown in Fig. 6. As expected, those classes exhibiting the best matches are chemically similar types: i.e., in size range 0.2–0.5 μm, OC class from coal burning boiler is similar to OC_Nitrate class from biomass burning boiler; in size range 0.5–1.0 μm, Al_Ti_Silicate class from coal burning boiler is similar to Al_Silicate class from biomass burning boiler. This result indicated that two sources might discharge particles with similar mass spectra.
Paper 4
Xu-2018-STE: Refined source apportionment of coal combustion sources by using single particle mass spectrometry
- In this study, samples of three typical coal combustion source types, including Domestic bulk coal combustion (DBCC), Heat supply station (HSS), and Power plant (PP) were sampled. For sampling coal combustion particles samples from PP and HSS, vehicle loaded SPAMS were placed under the chimney in the factories. During the sampling, a stainless steel tube was inserted in the sampling hole on the chimney enough, to make sure the tube could reach inside of the chimney. Airflow together with particle samples were pumped out through a closed silicone tube from chimney breast, and were then imported into the SPAMS. For sampling the real Domestic Bulk Coal Combustion particles in rural areas, particle samples were collected by a sampling bags, which were made by Teflon.
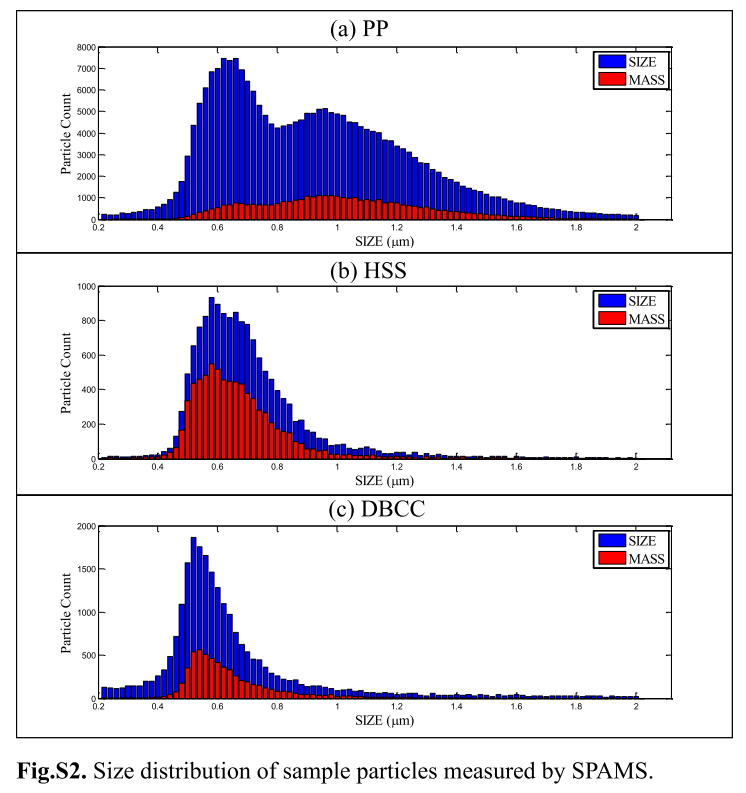
- It's important to note that size distribution measured by SPAMS can only provide semi-quantitative meanings, and size distribution result in this study might be different from the real world. In this study, size distribution of PP was wider than the other two, and that of DBCC was narrow. Besides, as shown in the figure, most of the particles concentrated in the sizes less than 1.0 μm.
- Mass spectra features of PP emitted particles: In this study, signals of these metal components, including silicate (m/z -60[SiO2]−, −76[SiO3]−), aluminum (m/z 27[Al]+, −43[AlO]−), calcium(m/z 40[Ca]+, 56[CaO]+) and iron (m/z 56[Fe]+), show significant intensities. Power plant coal burning mass spectral features obtained in this study is in consistent with Zhang's work (Zhang et al., 2005). They found the primary chemical components of the particulate matter emitted from the coal-fired power plants were SiO2, Al2O3, Fe2O3 and CaO. Besides, in Wang's study, who used ATOFMS to sample the aerosol produced during pulverized coal combustion in a drop tube furnace (Wang et al., 2013), also found that 27[Al]+, 39[K]+, 40[Ca]++, 56[Fe/CaO]+, elemental carbon clusters (including −24, −36, −48, −60 etc) and organic carbon fragments (including −45, −59, −73) appear in the average mass spectrum, which are consistent with the peaks found in our study.
- OC fragments were extracted as tracer signals for HSS and DBCC, and their intensities seem to be much higher than those in PP. This might be reasonable because pulverized coal combustion in PP has sufficient mixing of coal and air, and result in high efficiency. And DBCC has insufficient mixing of coal and air, which will result in much higher emissions of organic carbon. Signals corresponding to crustal chemical components like Si, Al and Ca, were extracted as tracer signals in PP source sample.
- First, coal is a complex mixture of many elements, different coal types have very different compositions. Second, combustion conditions play a very important role in particle formation, for example, temperature and gas condition. Third, air pollution control devices can greatly affect emission of particulate matter.
Paper 5
Wang-2013-ACP: Characterization of organic aerosol produced during pulverized coal combustion in a drop tube furnace
- Controlled bench scale pulverized coal combustion studies were performed. High-resolution time-of-flight aerosol mass spectrometer (HR-Tof-AMS) was applied to characterize fine particle formation during coal combustion. The average AMS organic mass spectra of aerosol from the drop tube coal combustor under various oxygen/coal ratios show that Many significant organic peaks are observed. Typical OC ions in AMS including C3H7+ (m/z 43.054779), C2H3O+ (m/z 43.018391), CO2+ (m/z 43.989830), m/z 55, C4H9+ (m/z 57.070431), C3H5O+ (m/z 57.034039), C2H4O2+ (m/z 60), C3H5O2+ (m/z 73), C7H7+ (m/z 91.054771). The ratio of C3H7+/C2H3O+ and C4H9+/C3H5O+ can be considered as an indicator of the extent of oxygenation. The peak at m/z 91 should originate from aromatic compounds, and the ion C7H7+ (m/z 91.054771) contains a benzene ring.
- In the spectra of HR-Tof-AMS, peaks at m/z 60 and 73 are generally considered as important biomass burning particle tracers. The ion C2H4O2+ (m/z 60) is traditionally considered to result from fragmentation of levoglucosan. To further characterize the organics, fine particulate matter from the coal combustor was collected, extracted and analysed by Aerosol Time-of-fight Mass Spectrometer (ATOFMS) and gas chromatography–mass spectrometry (GC/MS). Peaks at m/z of −45, −59 and −73 in ATOFMS spectra are usually considered as the fragments of levoglucosan. However, no levoglucosan was detected by GC/MS, which implies that other detected compounds (e.g. some carboxylic acids) most likely contributed to the observed m/z 60 and 73 in AMS, and m/z −45, −59 and −73 in ATOFMS. This observation implies that the peaks in AMS (m/z 60 and 73) and ATOFMS (m/z −45, −59 and −73) are not unique biomass burning tracers for particles in the atmosphere. Due to the mass spectral signatures overlap with some well-known biomass burning tracers, particles emitted from coal combustors have the potential to be incorrectly assigned as biomass burning aerosol by tracer based source apportionment. The similarity of the organic species in aerosol formed during coal combustion and biomass burning is due to the fact that coal has its origins from biomass and was formed via coalification, which is a process that reduces hydrogen and oxygen content of biomass (with cellulose, lignin, hemicellulose being the major components) and increases the fraction of carbon content (Haenel, 1992).
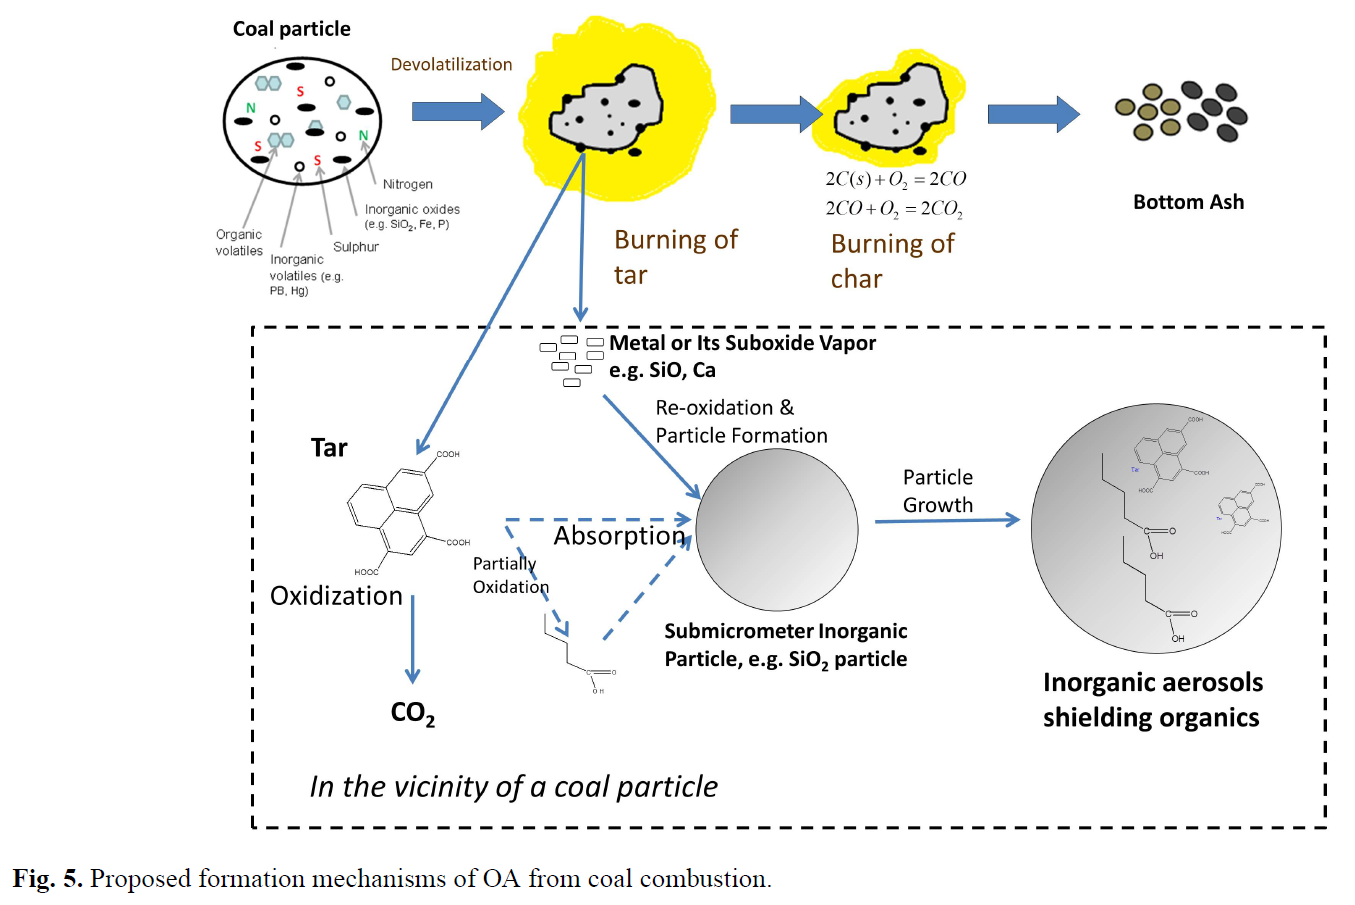
- Particles from coal combustion are a mixture of inorganic and organic compounds. The ATOFMS mass spectrum contains many inorganic peaks, such as Ca, Na and K. Organic matter is typically fully oxidized (to gaseous CO2 and CO) in air at high combustion temperatures. Thus, the organic matter detected in the particles was probably prevented from oxidation by unknown mechanisms in the combustor. A conjecture is proposed: the organic vapors are adsorbed by inorganic particles during coal combustion. After adsorption of organic vapors, inorganic particles may continue to grow, thereby covering and protecting organic matter from further oxidation. ... Figure 5 summarizes the proposed formation mechanisms of OA during pulverized coal combustion: Molecules in coal usually contain aromatic clusters which are connected by hydrocarbon bridges and loops. The bond strength of aromatic rings is much greater than those of the hydrocarbon bridges and loops. When coal particles are combusted in the furnace, bridges and loops break apart first. Tar, a group of compounds with smaller molecular weights, are released. In the furnace, most of gas-phase tar is quickly oxidized and fully combusted. However, some of the tar species are adsorbed by the inorganic ash particles with chemical composition such as SiO2, Al2O3, CaO and sulfate. These particles can protect tar from further oxidation. Therefore, particulate organic matter survives the highly oxidizing environment and may potentially be emitted to the atmosphere.
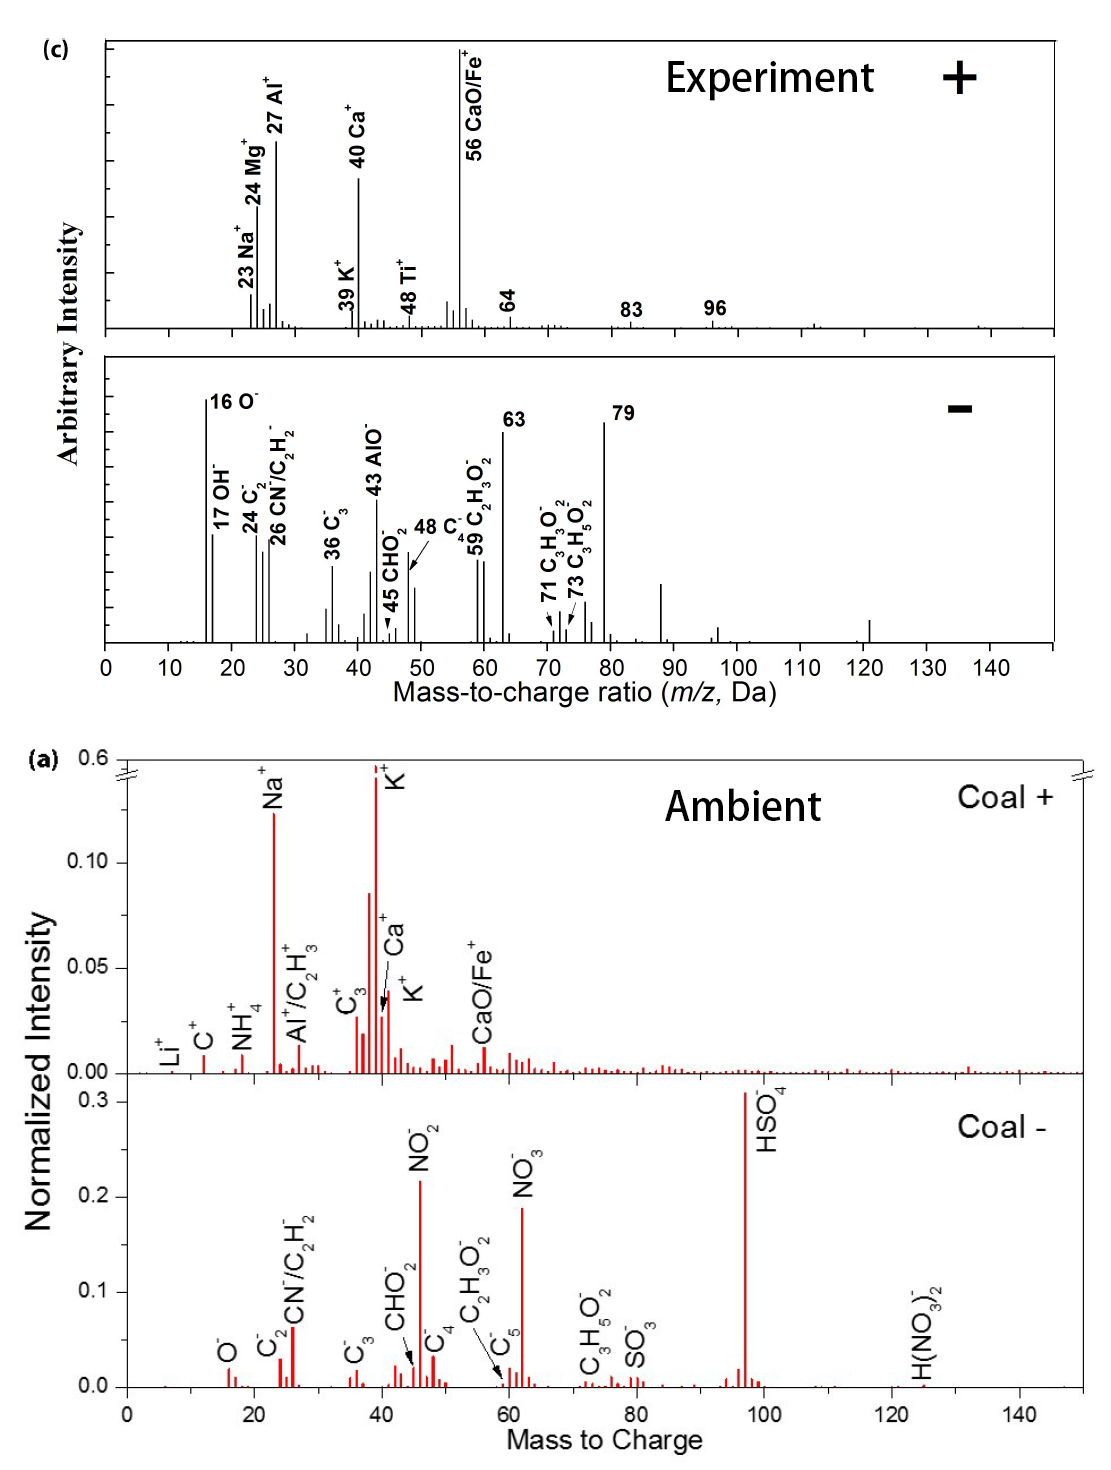
- Ambient aerosol was measured in Shanghai using ATOFMS. A unique type of particle observed in the atmosphere was identified from coal combustion. It has dominant potassium (K+) peaks in the positive spectrum and secondary inorganic peaks (NO2− ,NO3−, HSO4−, etc.) in the negative spectrum. Li, Al, Ca, CaO/Fe and other metal/metal oxide peaks were also present. Weaker peaks of Al+, Ca+, CaO/Fe+ may be due to the aging process of aerosols in the atmosphere: Oxides of Al, Ca, and Fe can quickly react with H2SO4 in the atmosphere to form sulfates which have a much lower ionization efficiency in the ATOFMS. Therefore, the Al+, Ca+, and CaO/Fe^+ peaks will be much weaker than those in freshly emitted particles. ... Other field studies have also reported certain types of ambient aerosols originating from coal combustion. For instance, a series of studies on ambient aerosol in Pittsburgh suggested that the particles with the signal of Na/Si/K/Ca/Fe/Ga/Pb were associated with coal combustion emissions. However, Healy et al. (2010) showed that Ga and Fe were not present in their coal combustion aerosols. In this study, Na/K/Ca/Fe and Pb were observed in the type of ambient aerosols, which is considered to originate from coal combustion, but no significant peak of Si and Ga was present. In addition, Liu et al. (2003) reported that coal combustion aerosols contain the signal of Li, while both Healy et al. (2010) and this study did not find this signal.
